


Which Mutual Fund Software Tracks Sub-broker Brokerage Payouts?
Key Takeaways
Growth Challenge: Just when MFDs feel happy about their growing network, sub-broker payout management makes them sit in silence and worry.
Better Process: But smart MFDs use a structured payout system that replaces spreadsheets with rate cards, category mapping, and automated monthly calculations.
Business Visibility: The best mutual fund software, such as RedVision Technologies, adds a brokerage analytics dashboard on top of this.
Long-Term Value: The result is a sub-broker network that runs on clear and traceable numbers.
Ten sub-brokers. Four different payout percentages. Monthly brokerage coming in from twelve AMCs.
And someone asking why their payout this month doesn't match what they calculated.
If you're running a growing MFD business, this is a real situation, not a hypothetical one.
Tracking sub-broker payouts manually through spreadsheets gets messy fast.
The right mutual fund software handles the entire flow, from brokerage earned to payout processed, inside one dashboard.
Why Does Manual Payout Tracking Fail You?
Spreadsheets work fine when you have two sub-brokers and one payout rate. Add five more sub-brokers with different rate cards, and the errors start stacking up.
Here's what goes wrong without a proper system:
Payout percentages get applied to the wrong sub-broker
Previous months' records are hard to trace
Sub-brokers call asking how their number was calculated
Reconciling actual brokerage against expected payout takes hours
Any change in a rate card means updating rows manually across files
Each of these problems costs time. Collectively, they cost trust inside your distribution network.
What Should a Payout Tracking System Actually Do?
A good payout system doesn't just calculate a number. It gives you control over the entire flow.
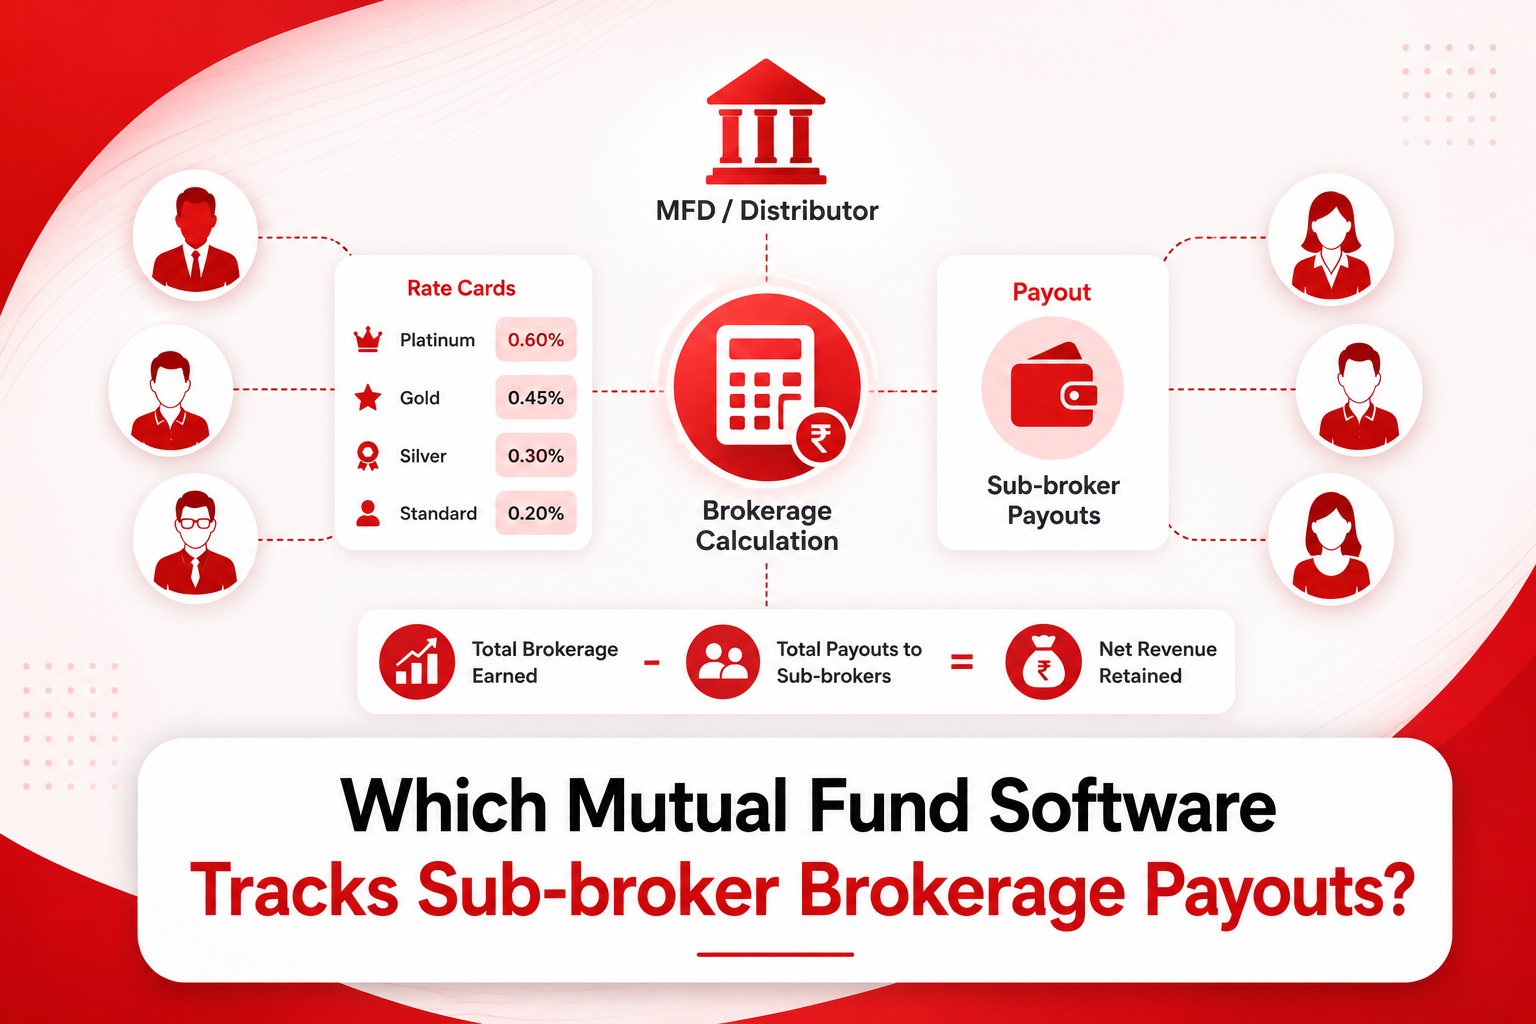
The best mutual fund software, such as RedVision Technologies, brings brokerage data, sub-broker categories, rate cards, and payout history into one place.
You see total brokerage earned, total payout owed, and net revenue retained, all from a single dashboard without opening a single spreadsheet.
How Do Rate Cards Work in Practice?
Rate cards are the foundation of structured payout management. They define each sub-broker's earnings based on their category.
Creating Categories
You group sub-brokers into tiers like Gold, Silver, or Platinum, or any custom label that fits your business.
Each category carries a fixed payout percentage.
Mapping Sub-brokers
Each sub-broker gets assigned to a category.
The software then automatically applies the correct percentage each month based on that mapping.
Tracking History
When a sub-broker's category changes, the system keeps a record.
You can check when they moved, what they were before, and what rate applies now. Nothing gets lost between months.
How Does Monthly Payout Calculation Work?
You select the month, pick the sub-broker or category, and the software pulls the brokerage earned for that period.
It applies the payout percentage and shows you the payable amount before you confirm anything.
You can review the numbers, adjust if needed, and record the transaction reference once paid.
The payout gets saved and stays accessible for future months. No recalculating. No re-entering. The record is there when a sub-broker asks about it six months later.
Does It Help Sub-brokers Understand Their Earnings?
Yes, and this part matters more than most MFDs realise.
Sub-brokers who can't understand their own payout become difficult to manage. Disputes slow everything down.
A dashboard that clearly shows brokerage earned, payout rate applied, and amount payable removes the guesswork.
MF software takes this further by letting you share payout reports directly to the sub-broker desk.
The sub-broker gets a clear statement without you having to explain the calculation every month. That transparency builds a more stable working relationship.
What Reports Does the Brokerage Dashboard Give You?
Beyond individual payouts, the dashboard gives you a business-level view:
Total brokerage earned across all AMCs
Total payout given to sub-brokers in a period
Net revenue retained after all payouts
Sub-broker-wise breakdown with custom date filters
Visual trend charts comparing gross brokerage against payouts over time
These reports tell you which sub-brokers are generating the most brokerage, where your payout obligations are highest, and whether your net income is growing or shrinking month on month.
That's information you need to make decisions about your network, not just to process payments.
Conclusion
Sub-broker payout tracking is a business control function, not just a back-office task.
A platform that automates the calculation, stores the history, and lets you share reports directly with sub-brokers saves hours every month and removes the disputes that slow your network down.
FAQs
Q1. Can I set different payout rates for different sub-brokers in the same software?
Yes. The software lets you create categories with fixed payout percentages and map each sub-broker to the right one.
Q2. What happens if I need to change a sub-broker's payout rate mid-year?
You update the category mapping inside the software. The new rate applies from the next payout cycle, and the system keeps a history of the previous category.
Q3. How does the MFD software help me share payout details with my sub-brokers?
Trusted mutual fund software like RedVision Technologies generates payout reports that can be shared directly to the sub-broker desk. The sub-broker receives a clear statement showing brokerage earned, payout percentage, and amount payable.
Q4. Can I see my total brokerage income after deducting all sub-broker payouts?
Absolutely. The brokerage dashboard shows total brokerage earned, total payout given to sub-brokers, and net revenue retained, all in one summary view.

 Arabic
 French
 Spanish
 Portuguese
 Deutsch
 Turkish
 Dutch
Dutch
 Italiano
 Russian
 Romaian
 Portuguese (Brazil)
 Greek
Greek