


Fixed Range Volume Profile Indicator: How to Use It on TradingView
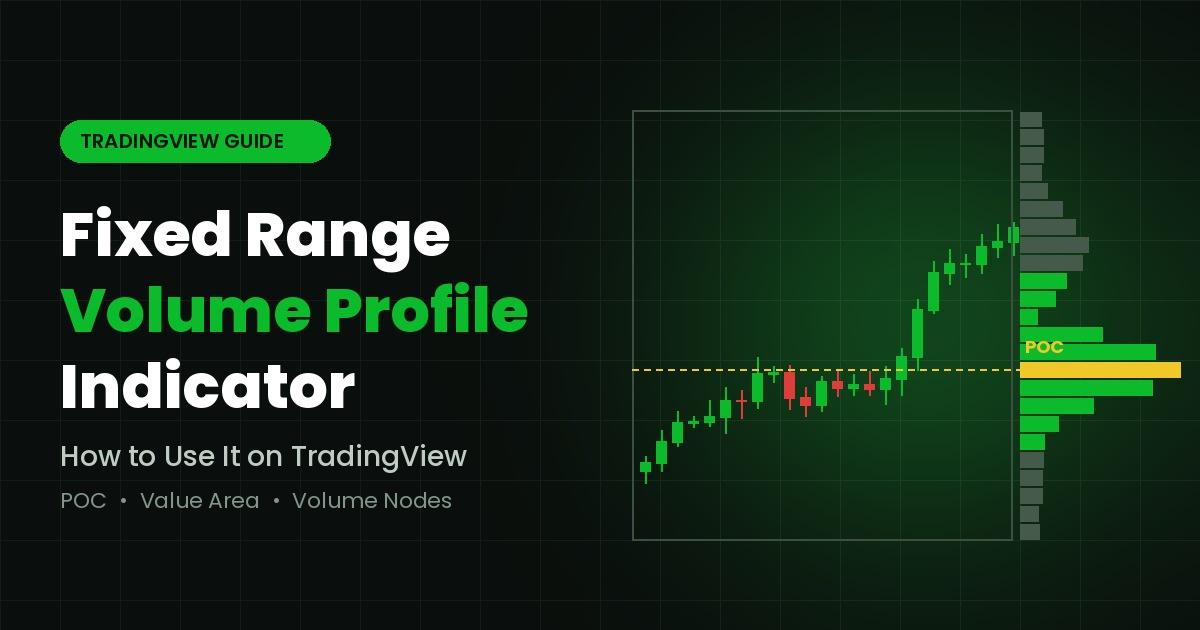
Most traders look at price and time. However, price charts hide one vital detail: where traders actually did business. A candle tells you the high and the low. It does not tell you where most shares or contracts changed hands.
That is exactly the gap a volume profile indicator fills. Instead of showing volume at the bottom of the chart by time, it shows volume on the side of the chart by price. As a result, you can see which levels the market accepted and which levels it rejected.
Among all the versions of this tool, the Fixed Range Volume Profile (FRVP) is the most flexible. It lets you choose the exact stretch of the chart you want to study. In this guide, you will learn what the tool is, how to add it on TradingView, how to read volume profile data, and how to turn that data into clear trading decisions.
What Is a Volume Profile Indicator?
A volume profile indicator plots a horizontal histogram next to price. Each bar shows how much volume traded at a given price level during a chosen period. Long bars mean heavy trading. Short bars mean light trading.
In simple terms, a volume profile indicator shows where buyers and sellers agreed on value. Price tends to slow down near heavy-volume areas. On the other hand, it often moves fast through thin areas because few orders sit there.
Key Terms You Need to Know
Before you use any volume profile indicator, learn its core vocabulary. These terms appear in every profile, whatever the market or timeframe.
- Point of Control (POC): The single price level with the highest traded volume. It acts like a magnet for price and often becomes strong support or resistance.
- Value Area (VA): The price range where about 70% of the volume traded. Traders treat it as the zone of "fair value" for that period.
- Value Area High (VAH): The top edge of the value area. Price above it is often seen as expensive.
- Value Area Low (VAL): The bottom edge of the value area. Price below it is often seen as cheap.
- High Volume Node (HVN): A cluster of long bars. It marks strong agreement and usually slows price down.
- Low Volume Node (LVN): A gap of short bars. It marks rejection, so price often moves quickly through it.
Once these six terms feel familiar, the rest of the tool becomes far easier to understand.
Why Choose the Fixed Range Version?
TradingView offers several types of volume profile. Each one answers a slightly different question.
For example, the Visible Range profile measures everything currently on your screen. Therefore, it changes every time you scroll or zoom. The Session Volume profile, meanwhile, builds a new histogram for each trading day. Both are useful, yet neither lets you pick a precise starting and ending point.
The fixed range volume profile indicator solves this problem. You simply click on one candle to start and another candle to end. The tool then measures volume only between those two points. Consequently, you can study a single trend leg, a consolidation range, or the move after a news event in isolation.
This precision matters. A profile drawn over the wrong range blends unrelated price action together. In contrast, a well-anchored fixed range shows you the true value of one specific market phase.
How to Add the Fixed Range Volume Profile on TradingView
Setting up this volume profile indicator takes less than a minute. Note that TradingView places some volume profile features behind paid plans, so check your account level first.
- Open your chart. Load the asset and timeframe you want to study.
- Find the tool. Look at the left drawing toolbar and open the forecasting and measurement group. Alternatively, type "Fixed Range Volume Profile" into the drawing search.
- Select the start point. Click on the first candle of the move or range you want to measure.
- Select the end point. Next, click on the last candle of that range. The histogram appears instantly.
- Adjust the anchors. Drag either edge left or right to refine the range. The profile updates as you move it.
Recommended Settings
After placing the volume profile indicator, double-click it to open its settings. A few small changes make the profile much clearer.
- Rows layout: Choose "Number of Rows" and start with around 24 to 50 rows. More rows give finer detail, while fewer rows give a cleaner view.
- Value Area volume: Keep it at 70%. This is the industry standard.
- Volume display: Select "Up/Down" to see buying and selling volume in different colors. Use "Total" for a simpler look.
- Extend POC: Turn on the option to extend the POC line to the right. This helps you see how future price reacts to that level.
With these settings in place, your chart is ready for analysis.
How to Read Volume Profile Data
Knowing how to read volume profile shapes is the real skill here. The histogram is not just a picture. Instead, it tells a story about who controlled the market and where.
Start With the POC
First, locate the Point of Control. If price trades above the POC, buyers usually hold the advantage. If price trades below it, sellers usually hold the advantage. Moreover, when price returns to an old POC, it often pauses or reverses there.
Check Where Price Sits Against the Value Area
Next, compare current price with the value area. Inside the VA, the market is in balance, so expect range-bound movement. Outside the VA, the market is out of balance. In that case, price either gets accepted at the new level or snaps back into value.
A useful rule follows from this. When price breaks out of the value area and then returns inside it, traders often expect a move toward the opposite edge.
Read the Profile Shape
The overall shape of the histogram also carries meaning:
- D-shape: Volume bulges in the middle. This signals a balanced market with no clear winner.
- P-shape: Volume is heavy near the top. This often appears after short covering or strong buying.
- b-shape: Volume is heavy near the bottom. This often appears after long liquidation or steady selling.
- Double distribution: Two separate bulges with a thin gap between them. The gap is a low volume node that price may cross quickly.
Watch the Nodes
Finally, mark the high and low volume nodes. HVNs act as speed bumps, so expect price to slow down there. LVNs act as open roads, so expect price to move fast through them. This simple idea alone can improve your entries and targets.
Practical Ways to Trade With the Fixed Range Profile
Theory only helps when you can apply it. Here are three common ways experienced traders use a volume profile indicator.
1. Trend Pullback Entries
Anchor the profile from the start of a trend leg to its swing high or low. Then, watch the POC of that leg. In a healthy uptrend, price often pulls back to this level before moving higher. Because many traders defended that price before, it tends to attract buyers again.
2. Range Breakout Confirmation
Draw the profile across a sideways consolidation. The VAH and VAL now mark the edges of balance. When price closes outside one edge and holds there, the breakout has real acceptance. However, if price quickly falls back inside, treat the breakout as a likely trap.
3. Target Setting With Low Volume Nodes
LVNs make excellent targets and stop guides. Since price moves quickly through thin areas, you can aim for the next HVN beyond an LVN. Likewise, placing a stop just beyond a nearby HVN gives your trade a logical buffer.
Volume Profile vs Market Profile
Many traders confuse these two tools. The volume profile vs market profile debate comes down to one key difference: what each one measures.
Volume profile measures actual traded volume at each price. Market profile, on the other hand, measures time. It counts how many time periods (often 30-minute blocks) price spent at each level. Market profile was developed by Peter Steidlmayer at the Chicago Board of Trade in the 1980s, and it uses letters called TPOs to build its shape.
Both tools reveal value and balance. Still, volume profile is usually preferred for liquid markets because volume shows real commitment, not just time spent. In contrast, market profile works well when you want to study how the auction developed through the session. Many professionals simply use both side by side.
Common Mistakes to Avoid
Even a powerful volume profile indicator fails when traders use it poorly. Watch out for these frequent errors:
- Random anchoring: Always anchor at meaningful swing points, not at arbitrary candles.
- Ignoring context: A volume level means little without trend direction and market structure.
- Too many profiles: Stacking several profiles on one chart creates clutter and confusion.
- Trusting thin data: On illiquid assets or decentralized forex feeds, volume data can be less reliable.
- Trading levels blindly: Always wait for a price reaction at a level before entering.
Final Thoughts
The fixed range volume profile indicator turns a flat price chart into a map of real market interest. By learning how to read volume profile levels such as the POC, value area, and volume nodes, you can find better entries, smarter stops, and clearer targets. Above all, practice on historical charts first and build confidence before risking capital.
Many traders pair volume analysis with other signal tools to confirm their decisions. GainzAlgo is one such option that traders often research, and a common question they ask is "is GainzAlgo legit?" The best approach is to review independent user feedback, test any tool on a demo account, and always combine signals with your own volume profile indicator analysis and sound risk management.

 English
 Arabic
 French
 Spanish
 Portuguese
 Deutsch
 Turkish
 Dutch
 Italiano
 Russian
 Romaian
 Greek