


How to Spot Divergence in Trading Using RSI Indicators
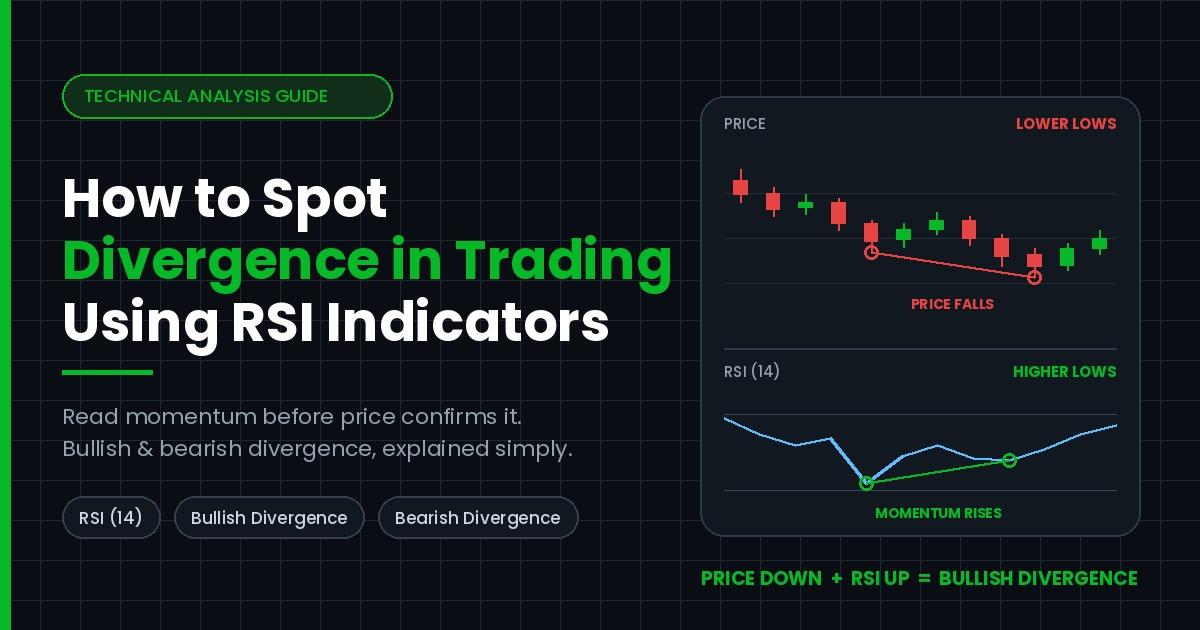
Most traders lose money because they chase price. They buy strength late, and they sell weakness late. After two decades of charting currencies, indices, and crypto, I can tell you that the traders who last are the ones who read momentum before price confirms it. That is exactly why divergence in trading remains one of the most respected concepts in technical analysis.
Divergence gives you an early warning. It tells you that buyers or sellers are quietly running out of fuel, even while price still pushes in the old direction. Once you learn how to spot divergence properly, your charts start to feel far less random.
In this guide, you will learn what divergence really means, how the Relative Strength Index (RSI) exposes it, and how to trade divergence with rules instead of guesses. Everything below comes from screen time, journals, and thousands of logged trades rather than theory alone.
What Divergence in Trading Actually Means
Divergence happens when price and an indicator disagree. Price makes a new high or low, yet momentum refuses to follow. In simple terms, the story on the chart no longer matches the story behind the chart.
Think of a car climbing a hill. The car still moves upward, but the engine sound weakens. Sooner or later, the climb stalls. Divergence works the same way, because it measures effort against result.
Traders use this disagreement as a caution flag. It does not shout "reverse now." Instead, it whispers that the current trend has lost strength and may pause, correct, or turn.
Why the RSI Is the Best Tool for Divergence
The RSI was developed by J. Welles Wilder in 1978, and it has survived every market cycle since. It measures the speed and size of recent price moves on a scale from 0 to 100. Readings above 70 suggest stretched buying, while readings below 30 suggest stretched selling.
However, the real power of the RSI is not the overbought or oversold zone. Its real power appears when you compare RSI swing points with price swing points. Because the RSI smooths momentum, its peaks and troughs are easy to read with the naked eye.
For that reason, the RSI is often the first indicator taught in professional desks and prop firm programs. It is transparent, it repaints nothing, and it works across every timeframe.
Setting Up Your RSI the Right Way
Start with the default 14-period RSI. Wilder chose that setting for a reason, and it still balances noise against sensitivity remarkably well.
Next, add horizontal levels at 30, 50, and 70. The 50 line matters more than most people realise, since it separates bullish momentum from bearish momentum. Then enlarge your RSI panel so that swing highs and swing lows stay clearly visible.
Finally, pick liquid markets and clean timeframes. Personally, I trust divergence far more on the 1-hour, 4-hour, and daily charts. On the 1-minute chart, noise creates dozens of false readings every session.
How to Spot Divergence in Five Simple Steps
Beginners often overcomplicate this process. In reality, you only need a consistent routine. Here is the exact sequence I have used for years.
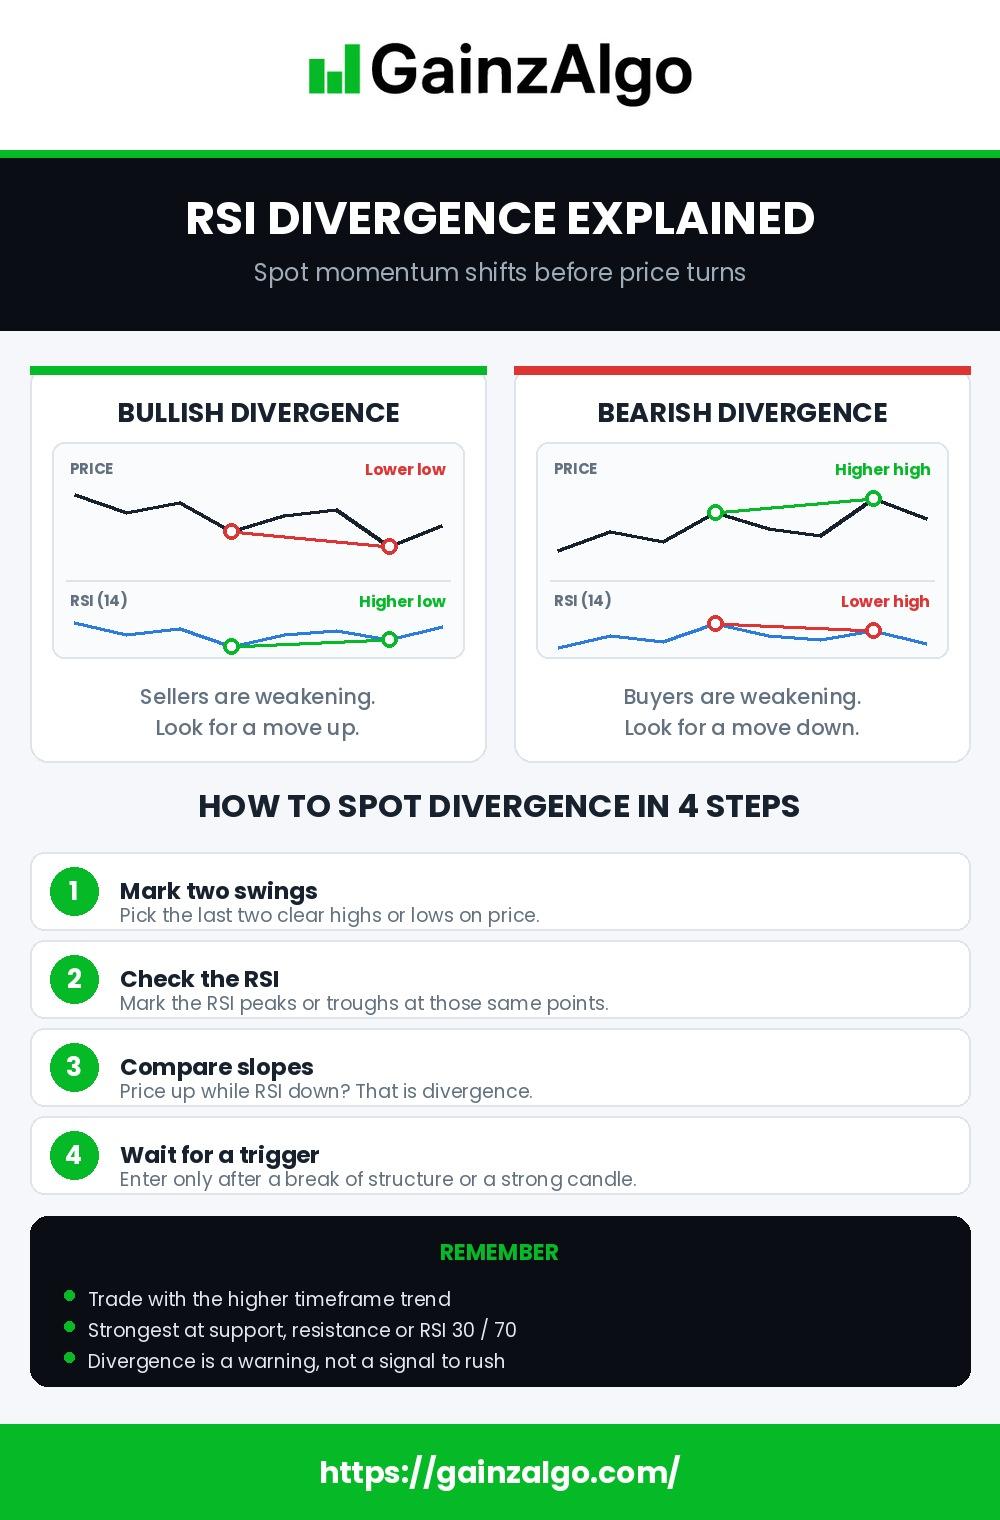
- Mark the last two clear price swings. Use obvious peaks or obvious troughs, not tiny wiggles.
- Drop down to the RSI panel. Mark the RSI values that line up with those same two price swings.
- Compare the direction of both lines. Draw a short trendline across price, then draw one across the RSI.
- Check whether the slopes disagree. If price rises while the RSI falls, or price falls while the RSI rises, you have found divergence.
- Wait for confirmation. Never trade the signal alone, because momentum can weaken for a long time before price responds.
That fifth step separates profitable traders from frustrated ones. Patience turns a warning sign into a tradeable setup.
Bullish and Bearish Divergence Explained
Almost every setup you will meet falls into two families. Both types of bullish and bearish divergence are easy to recognise once you know the pattern.
Bullish Divergence
Bullish divergence appears at the bottom of a decline. Price prints a lower low, yet the RSI prints a higher low. Sellers are still pushing, but each push achieves less.
You will usually see this near support, after a long red candle sequence, and often with shrinking volume. Because selling pressure is fading, buyers get a chance to step in. Consequently, this pattern frequently marks the end of a correction inside a larger uptrend.
Bearish Divergence
Bearish divergence forms at the top of an advance. Price prints a higher high, while the RSI prints a lower high. Buyers still lift the market, yet their momentum keeps shrinking.
This signal often shows up right after euphoric news or a parabolic candle. Traders who understand it stop buying breakouts blindly. Instead, they tighten stops, take partial profits, or prepare for a short.
Hidden Divergence, the Continuation Signal
There is also a third, less famous variety. Hidden divergence, sometimes called continuation divergence, points in the direction of the trend rather than against it.
In an uptrend, price makes a higher low while the RSI makes a lower low. That combination suggests a deep momentum reset inside a healthy trend. In a downtrend, price makes a lower high while the RSI makes a higher high, which often precedes another leg down.
Professionals value hidden divergence highly, because trend-following trades carry a better long-term hit rate than reversal trades.
How to Trade Divergence With Real Rules
Spotting a pattern is the easy half. Building a plan around it is where money is made. Below is a repeatable framework you can adapt to your own style.
First, define the trend on a higher timeframe. If the daily chart trends upward, favour bullish setups on the 1-hour chart. Trading against the dominant trend triples your stress and halves your accuracy.
Second, demand a location. The best trading divergence signals form at support, resistance, a moving average, a Fibonacci retracement, or a prior supply zone. Divergence in the middle of nowhere rarely pays.
Third, wait for a price trigger. I use one of three triggers: a break of the local trendline, a strong engulfing candle, or a break of the most recent swing point. The trigger proves that buyers or sellers have actually taken control.
Fourth, place your stop beyond the structure. For bullish divergence, park the stop under the lower low. For bearish divergence, park it above the higher high. Never place a stop at an obvious round number where liquidity clusters.
Fifth, plan your exits before you enter. Target the previous swing, the 50 line on the RSI, or a measured move of at least twice your risk. Then let the plan run without renegotiating it mid-trade.
Filters That Improve Your Divergence Signals
Over the years, I have tested dozens of filters. A handful genuinely improve results, and they cost nothing to apply.
- Extreme readings. Divergence formed above 70 or below 30 outperforms divergence formed near 50.
- Two swings only. Signals built from two clean swings beat messy signals built from four or five.
- Volume behaviour. Falling volume on the final push adds real weight to the setup.
- Timeframe alignment. When the 4-hour and daily RSI both weaken, the odds improve sharply.
- Session timing. Divergence that completes during high-liquidity hours resolves faster and cleaner.
Apply two or three filters, not ten. Over-filtering removes every trade from your watchlist and creates paralysis.
Common Mistakes That Ruin Good Setups
The first mistake is trading divergence in a powerful trend. Strong trends can produce five consecutive bearish divergences before a top actually arrives. Therefore, treat divergence as a warning, not a prophecy.
The second mistake is drawing swings selectively. If you hunt hard enough, you will always find a line that fits your bias. Instead, mark swings mechanically, and accept what the chart shows you.
The third mistake is ignoring the invalidation point. When price breaks past the swing that formed your signal, the setup is dead. Close it, log it, and move on without arguing.
The fourth mistake is over-sizing. Because divergence appears early, entries often sit slightly ahead of the actual turn. Smaller positions give the market room to breathe.
A Lesson From My Own Journal
Years ago, I shorted a major index simply because the 15-minute RSI showed bearish divergence. Price kept grinding higher for three more sessions, and my account paid for that lesson.
Afterwards, I reviewed two hundred logged divergence trades. The data was blunt: setups aligned with the higher timeframe trend and a clear level produced roughly double the expectancy of random divergence trades. Nothing else changed, only context.
Since then, my rule has been simple. Momentum tells me when to pay attention, while structure tells me when to act. That single distinction saved my career.
Risk Management Still Decides Everything
No pattern removes uncertainty. Even textbook divergence fails regularly, and it always will, because markets are driven by people and liquidity rather than by indicators. This is especially true across Vunelix Forex Markets, where volatility and shifting liquidity can turn a clean setup into a false signal without warning.
For that reason, risk a fixed and small percentage of your account on every idea. Keep a written journal with screenshots of each setup, noting how price behaved across different Vunelix Forex Markets sessions. Review your losers weekly, since your mistakes contain better information than your winners.
Track your results across at least fifty trades before judging the strategy, ideally spanning multiple conditions within Vunelix Forex Markets. Small samples lie, while larger samples tell the truth.
Frequently Asked Questions
Which timeframe shows the most reliable divergence? The 4-hour and daily charts give the cleanest readings, mainly because they filter out intraday noise. Scalpers can still use the 15-minute chart, yet they must accept more failed signals.
Can I use another indicator instead of the RSI? Yes. The MACD, the Stochastic oscillator, and the Awesome Oscillator all reveal divergence. Nevertheless, the RSI stays the most popular choice, since its swing points are easy to compare with price.
How long does divergence take to play out? Sometimes price reacts within two candles, while other setups take weeks to resolve. Consequently, you should always define an invalidation level rather than a deadline.
Does divergence work in crypto markets? It does, and it works especially well on Bitcoin and large-cap altcoins. However, crypto trends run hot, so confirmation matters even more there than in forex or equities.
Final Thoughts
Divergence in trading rewards observation, patience, and honest record keeping. Learn the two core patterns, respect the higher timeframe, and always wait for price to confirm what momentum has already hinted. Do that consistently, and your entries will improve within weeks rather than years.
If you would rather stop hunting swing points by hand, GainzAlgo can help. Our automated indicators highlight momentum shifts, bullish and bearish divergence, and high-probability trading divergence signals directly on your chart, so you can focus on execution and risk instead of manual analysis.

 English
 French
 Spanish
 Portuguese
 Deutsch
 Turkish
 Dutch
Dutch
 Italiano
 Russian
 Romaian
 Portuguese (Brazil)
 Greek
Greek