


Graphite Prices 2026: What Does the Latest Price Chart Show?
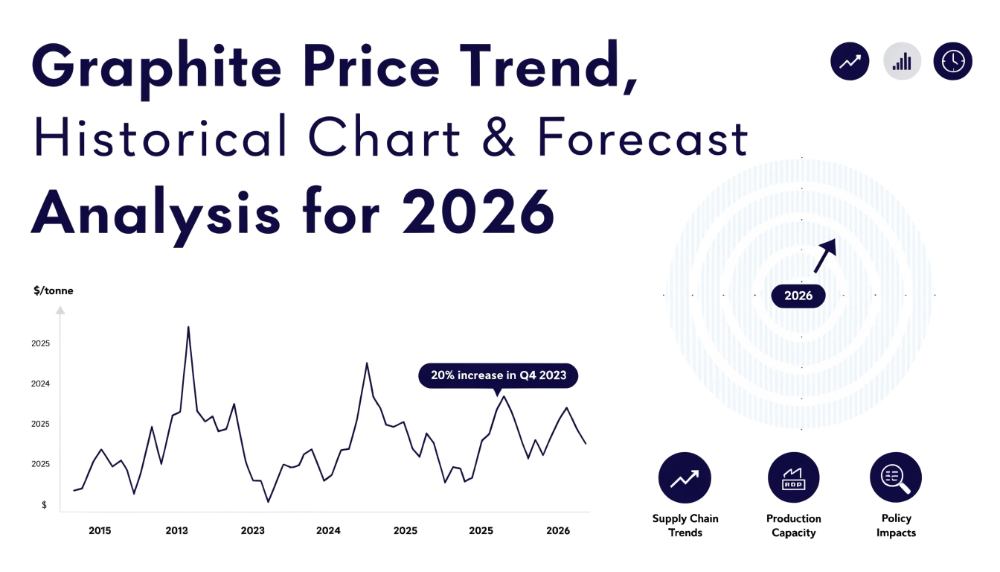
Global Graphite Price Trends & Updates – Q2 2026
Graphite Prices in Q2 2026 showed a wide regional spread, with reported benchmarks ranging from USD 542/MT in China to USD 1,946/MT in Brazil. The available Q2 dataset confirms substantial differences across consuming and trading markets, although a verified quarter-on-quarter percentage change was not provided, so no percentage movement is stated here. The latest Graphite Price Chart 2026 provides a useful reference for procurement teams comparing regional benchmarks and assessing sourcing conditions. IMARC Group’s Q2 2026 price-tracking database and methodology indicate that regional pricing differences remain important for buyers evaluating supply availability, logistics, production costs, and delivered procurement economics.
Regional Graphite Prices: Q2 2026 Snapshot
- USA: USD 852/MT
- China: USD 542/MT
- Germany: USD 803/MT
- Brazil: USD 1,946/MT
- United Kingdom: USD 1,453/MT
The Q2 2026 figures show a pronounced regional pricing gap. China recorded the lowest benchmark at USD 542/MT, while Brazil posted the highest at USD 1,946/MT, creating a USD 1,404/MT spread. The USA and Germany remained comparatively close at USD 852/MT and USD 803/MT, while the United Kingdom stood higher at USD 1,453/MT. Such differences can reflect variations in supply availability, import exposure, freight costs, production economics, and local demand conditions. For procurement teams, the spread highlights the importance of comparing regional benchmarks rather than relying on a single global reference when evaluating sourcing costs.
Q2 2026 Price Analysis: Where Are Regional Graphite Benchmarks Moving?
North America Graphite Prices: USA Benchmark
The USA benchmark stood at USD 852/MT in Q2 2026. A quarter-on-quarter direction cannot be verified from the supplied dataset because the previous-quarter price was not provided. The benchmark indicates a market where purchasing conditions need to be assessed alongside industrial demand, inventory levels, import costs, and logistics.
Asia-Pacific Graphite Prices: China Benchmark
China recorded USD 542/MT, the lowest reported benchmark in the supplied Q2 dataset. The available data does not establish a verified quarterly direction. Local production capacity, export availability, downstream industrial demand, and trade conditions are key factors when interpreting the benchmark.
Japan and India: No verified Q2 2026 prices were supplied for these two countries, so country-level price or trend claims would require additional data.
South America Graphite Prices: Brazil Benchmark
Brazil recorded USD 1,946/MT, the highest benchmark among the five supplied markets. The dataset does not provide a previous-quarter comparison, preventing a verified uptrend or downtrend assessment. The elevated benchmark may warrant closer monitoring of import dependence, freight, supply availability, and industrial purchasing conditions.
Supply And Demand Overview – Q2 2026
Graphite pricing during Q2 2026 remained closely connected to the balance between available supply and industrial consumption. Changes in production availability can quickly influence regional benchmarks, particularly where buyers depend on imported material.
Demand from steelmaking, refractories, batteries, lubricants, foundries, and other industrial applications remains important to purchasing requirements. Battery-related consumption is particularly relevant for certain graphite grades, while traditional industrial applications continue to influence broader demand.
Graphite Price Trend 2026: What Does the Quarterly Data Show?
The Q2 2026 dataset highlights regional divergence rather than a single uniform global movement. China’s USD 542/MT benchmark was substantially below Brazil’s USD 1,946/MT level, while the USA and Germany remained within a relatively narrow range.
A precise quarterly index movement and comparison with Q1 2026 cannot be calculated from the supplied figures because no Q1 benchmark or percentage change was provided. Accordingly, the Q2 data should be treated as a regional benchmark snapshot rather than a quantified quarter-on-quarter index series.
Graphite Price Forecast 2026: What Could Happen Over the Next 12 Months?
Over the next 12 months, pricing conditions are likely to remain sensitive to production availability, downstream industrial demand, energy expenses, freight costs, inventory levels, and international trade flows. Stronger battery-material consumption or tighter availability could support firmer pricing in affected regions.
Conversely, increased production, weaker industrial activity, or improved supply availability could place downward pressure on benchmarks. Procurement teams should therefore monitor regional rather than purely global indicators, particularly where delivered costs differ substantially between origins.
Key Factors Affecting Graphite Prices: Quarterly Perspective
- Energy costs: Higher electricity and fuel expenses can increase processing and production costs.
- Industrial demand: Steel, refractories, foundries, lubricants, and battery applications influence consumption.
- Battery-sector demand: Changes in anode-material requirements can affect demand for suitable graphite grades.
- Freight rates: Shipping costs can widen differences between producing and consuming regions.
- Trade flows: Export restrictions, tariffs, customs measures, and changing trade routes can alter regional availability.
- Production capacity: New capacity, maintenance, shutdowns, and utilization rates can change supply balances.
- Inventory levels: Restocking can temporarily strengthen demand, while high inventories can reduce spot purchasing pressure.
What Is Graphite and Why Does Its Price Matter?
Graphite is a naturally occurring form of crystalline carbon known for its electrical conductivity, thermal stability, lubricating properties, and resistance to high temperatures. It is used in refractories, steelmaking, foundry products, lubricants, electrodes, and battery materials.
Its commercial pricing varies according to grade, purity, processing requirements, application, origin, and delivery conditions. For buyers, understanding these specifications is essential because two regional benchmarks may not represent identical product qualities or cost structures.
Recent Graphite Developments: Q2 2026 Highlights
During Q2 2026, procurement conditions remained influenced by production availability, international trade flows, downstream industrial requirements, and regional logistics. However, the supplied dataset does not include verified company-specific capacity additions, supplier announcements, or individual trade-policy events. These developments should therefore be incorporated only after confirmation from authoritative market or company sources.
The regional benchmark spread itself remains an important Q2 highlight, particularly the difference between China and Brazil, which can materially affect sourcing comparisons and delivered-cost assessments.
FAQs About Graphite Price What Do Buyers Need to Know?
What Were Graphite Prices in Q2 2026?
Reported Q2 2026 benchmarks ranged from USD 542/MT in China to USD 1,946/MT in Brazil. The USA was at USD 852/MT, Germany at USD 803/MT, and the United Kingdom at USD 1,453/MT.
What Does the Graphite Price Trend Show In 2026?
The available Q2 data shows significant regional price differences, but it does not include Q1 figures or a verified percentage change. Therefore, a precise quarter-on-quarter direction cannot be established from the supplied dataset alone.
What Does the Graphite Price Chart Indicate?
The Graphite Price Chart highlights substantial differences between regional benchmarks, with China at the low end and Brazil at the high end in Q2 2026. Such variation can reflect differences in supply, demand, freight, production economics, and trade conditions.
How IMARC Group Helps with Graphite Price Intelligence
IMARC Group’s Q2 2026 price-tracking database and methodology provide a structured view of graphite benchmarks across key sourcing locations. Brazil recorded the highest supplied benchmark, while China recorded the lowest, creating a substantial regional spread. The USA and Germany remained below the United Kingdom in the reported dataset. These benchmarks can help procurement teams evaluate supplier quotations, compare sourcing economics, and identify regional cost gaps. Looking ahead, monitoring battery demand, industrial consumption, processing capacity, trade flows, and freight will be important for anticipating graphite procurement costs.
Explore pricing coverage across 500+ commodities: https://www.imarcgroup.com/pricing-intelligence
Contact Us:
IMARC Group
134 N 4th St., Brooklyn, NY 11249, USA
Email: sales[@]imarcgroup.com
Tel No:(D) +91 120 433 0800
United States: +1-201971-6302

 English
 Arabic
 French
 Spanish
 Portuguese
 Deutsch
 Turkish
 Dutch
Dutch
 Russian
 Romaian
 Portuguese (Brazil)
 Greek
Greek