


Ethylene Glycol Price Forecast 2026: Key Market Trends
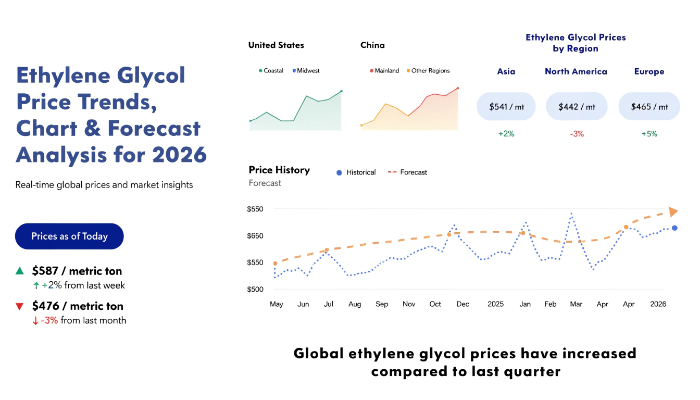
Global Ethylene Glycol Prices Outlook – 2026
The Ethylene Glycol Price Trend 2026 reflects differences in regional supply, manufacturing costs, and demand from the polyester and packaging industries. In Q2 2026, reported prices ranged from USD 425/MT in the USA to USD 600/MT in Germany. Buyers reviewing the Ethylene Glycol Price Forecast can use these benchmarks to compare sourcing costs and support procurement planning.
According to IMARC Group's Q2 2026 price-tracking database and methodology, regional price monitoring helps businesses assess market conditions and purchasing opportunities. However, the supplied figures do not include Q1 comparisons, so the overall quarterly direction and percentage change cannot be verified. This report examines the available regional prices, supply-demand factors, and potential influences on the market outlook.
Ethylene Glycol Prices Q2 2026: Regional Price Snapshot
- USA: USD 425/MT
- China: USD 532/MT
- Germany: USD 600/MT
- Saudi Arabia: USD 522/MT
- Brazil: USD 529/MT
Germany recorded the highest reported price, while the USA had the lowest, creating a spread of USD 175/MT. China, Brazil, and Saudi Arabia remained within a relatively narrow range of USD 522–532/MT. These differences may reflect regional production economics, logistics, feedstock availability, and demand conditions. However, the available figures alone cannot establish the specific reasons for these price gaps.
Ethylene Glycol Price Analysis by Country and Region
North America: USA Ethylene Glycol Prices
The US price stood at USD 425/MT in Q2 2026. Domestic production, ethylene feedstock costs, plant operating rates, and demand from polyester manufacturing influence market conditions. Export activity and inventory levels can also affect regional availability. Without Q1 data, the quarterly price direction cannot be confirmed.
Asia-Pacific: China Ethylene Glycol Prices
China recorded USD 532/MT. Demand from polyester fibres, packaging, and textile manufacturing influences consumption, while domestic production, imports, and plant operating rates affect supply. Changes in industrial activity and feedstock costs may influence future pricing.
Europe: Germany Ethylene Glycol Prices
Germany recorded USD 600/MT, the highest reported price among the five markets. Manufacturing costs, feedstock availability, transportation expenses, and industrial demand may contribute to regional price differences. Comparable historical data is needed to determine the quarterly trend direction.
Middle East: Saudi Arabia Ethylene Glycol Prices
Saudi Arabia recorded USD 522/MT. Feedstock availability, production economics, export commitments, and shipping costs can influence regional supply conditions. The available price does not independently establish whether demand strengthened or weakened during Q2.
South America: Brazil Ethylene Glycol Prices
Brazil recorded USD 529/MT. Import costs, freight expenses, currency movements, and demand from packaging and textile industries can influence purchasing costs. Local availability and international supply conditions are also relevant to procurement decisions.
Ethylene Glycol Supply and Demand Overview – Q2 2026
Ethylene glycol production depends on ethylene feedstock availability, manufacturing capacity, and plant operating rates. Demand is closely connected to polyester fibres, polyethylene terephthalate (PET) resin, packaging, textiles, and automotive applications.
Changes in manufacturing activity, inventory levels, import requirements, and production interruptions can influence regional supply-demand balances. The reported Q2 prices highlight differences across markets, but additional production and consumption data would be needed to identify the main drivers behind those differences.
Ethylene Glycol Price Trend and Historical Analysis
The Ethylene Glycol Price Trend can be evaluated by comparing quarterly prices and tracking a consistent price index. The available Q2 2026 figures establish regional benchmarks, but Q1 prices and historical index values were not supplied. Therefore, a verified quarterly percentage change cannot be calculated.
An ethylene glycol price history chart helps procurement teams monitor historical movements, compare regional benchmarks, and identify periods of volatility. Consistent units, reporting periods, and pricing locations are essential for reliable comparisons.
Ethylene Glycol Price Forecast 2026: Next 12 Months
Over the next 12 months, prices will depend on ethylene feedstock costs, production capacity, polyester demand, and international trade. A reliable numerical forecast requires additional historical prices and updated supply-demand information.
Buyers should monitor:
- Ethylene feedstock costs and production rates.
- Demand from polyester, PET, and textile manufacturers.
- Inventory levels and plant maintenance.
- Freight expenses and import requirements.
- Changes in global manufacturing activity.
These indicators can help procurement teams prepare budgets, compare supplier quotations, and manage exposure to price fluctuations.
Key Factors Affecting Ethylene Glycol Prices
- Feedstock costs: Ethylene prices influence production economics.
- Energy expenses: Fuel and electricity costs affect manufacturing operations.
- Polyester demand: Textile and packaging activity influences consumption.
- PET production: Demand from PET resin manufacturers supports ethylene glycol consumption.
- Freight costs: Transportation expenses affect delivered prices.
- Production capacity: Plant outages and operating rates can change supply availability.
- Trade conditions: Import dependence and export flows contribute to regional price differences.
These factors should be evaluated together to understand market movements and purchasing risks.
What Is Ethylene Glycol?
Ethylene glycol is an industrial chemical commonly used to manufacture polyester fibres, PET resin, and antifreeze formulations. It is an important raw material for textile, packaging, automotive, and chemical industries.
Its demand is closely linked to downstream manufacturing. As a result, changes in polyester production, packaging consumption, feedstock costs, and industrial activity can influence its market price.
Recent Ethylene Glycol Market Developments – Q2 2026
The reported Q2 prices ranged from USD 425/MT in the USA to USD 600/MT in Germany. However, verified announcements about new production capacity, supplier changes, or specific trade developments were not provided.
Procurement teams should monitor plant operating rates, ethylene availability, inventory levels, export volumes, and downstream polyester demand to better understand future market movements.
Frequently Asked Questions About Ethylene Glycol Prices
What Was the Ethylene Glycol Price Trend in Q2 2026?
Reported prices ranged from USD 425/MT in the USA to USD 600/MT in Germany. The available figures show regional differences but do not establish whether prices increased or decreased compared with Q1.
What Does an Ethylene Glycol Price Chart Show?
An Ethylene Glycol Price Chart displays historical prices and regional differences. It helps buyers monitor price volatility, compare supplier benchmarks, and support procurement planning.
What Is the Ethylene Glycol Price Forecast for 2026?
The outlook depends on ethylene costs, production capacity, polyester demand, freight expenses, and international trade. A reliable numerical forecast requires additional historical data and updated supply-demand indicators.
How IMARC Group Helps Businesses Track Ethylene Glycol Prices
IMARC Group provides pricing intelligence to support procurement and cost planning. Its resources help businesses compare regional benchmarks and review historical price movements. Buyers can use these insights to evaluate supplier quotations and sourcing options. Monitoring feedstock costs, production levels, and downstream demand will remain important for assessing ethylene glycol prices over the next 12 months.
Browse More Related Reports:
- PET Resin Price Trend Analysis: https://www.imarcgroup.com/pet-resin-price-trend
- Polyester Filament Yarn (PFY) Price Trend Analysis: https://www.imarcgroup.com/polyester-filament-yarn-pricing-report
Contact Us:
IMARC Group
134 N 4th St., Brooklyn, NY 11249, USA
Email: sales[@]imarcgroup.com
Tel No:(D) +91 120 433 0800
United States: +1-201971-6302

 English
 Arabic
 French
 Spanish
 Portuguese
 Deutsch
 Turkish
 Dutch
Dutch
 Italiano
 Russian
 Romaian
 Greek
Greek