Freeport-McMoRan said third-quarter copper output matched its expectations, but about 60,000 ounces of gold slipped into the fourth quarter. Our cash flow data shows operating cash rising in the first half of 2026.
Freeport-McMoRan Inc. (FCX) said its mines produced about 830 million pounds of copper and about 230 thousand ounces of gold in the third quarter of 2026. Both results matched the company's expectations. Gold sales tell a different story. Freeport expects about 100 thousand ounces of sales, below its July estimate, because roughly 60 thousand ounces of refined gold moved from the third quarter into the fourth.
The operational update, dated October 2, 2026, leaves out most of the financial detail. Read alongside the quarterly cash flow and annual income figures in our own database, it describes a company whose operating cash is recovering while the Grasberg mine works back toward full output.
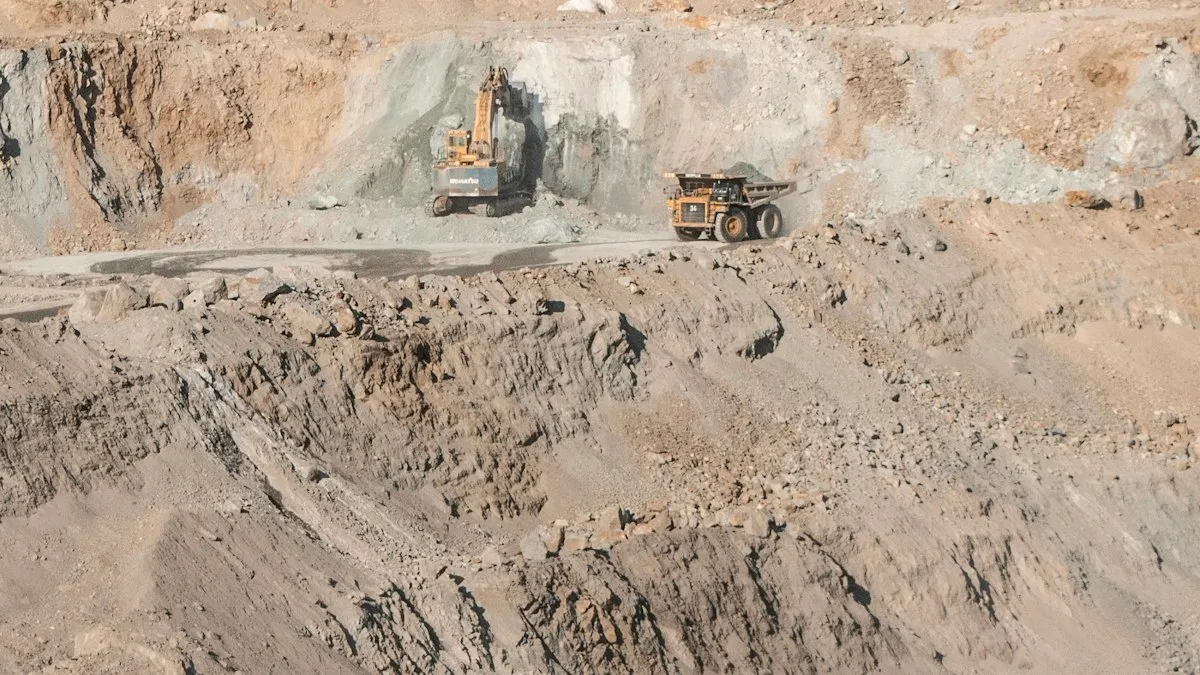
Grasberg is still running at about two-thirds of its normal rate
The Grasberg Block Cave mill averaged about 140,000 metric tons of ore per day during the quarter. Freeport puts that at about 67% of the normalized rate that applied before September 2025. As calculated by Trend & Ticker, that percentage implies a normalized rate of about 209,000 metric tons per day.
Mill throughput sets the ceiling on how much ore becomes metal. That makes it a better guide to the recovery than any single quarter of copper output. The company's stated targets call for 80% of capacity by mid-2027 and near full capacity by the end of 2027. Those two dates are the markers to track.
The distance to the first target is modest on paper. Moving from about 67% to 80% of the normalized rate is a gain of roughly 13 percentage points. The update does not give a throughput path between now and mid-2027, so the pace in between is not visible from the company's own figures.
Copper and gold guidance, read against the cost of copper
Freeport expects unit net cash costs of about 5% above the July 2026 estimate of $2.00 per pound of copper. It also expects an average realized copper price above $6.50 per pound. Copper sales guidance of 750 million pounds matches the July estimate.
As calculated by Trend & Ticker, a unit cost near $2.10 against a realized price above $6.50 leaves a spread of more than $4.40 per pound. That spread is a simple difference between two guided figures. It says nothing about capital spending, taxes or the cost of the ramp itself, and a reader should not treat it as a profit forecast.
Gold works differently. Third-quarter output of about 230 thousand ounces sits well above the sales guidance of about 100 thousand ounces. The gap is the deferred refined gold, which the company said moves into the fourth quarter. Production and sales can differ in any quarter. This one should show up in reported revenue once the deferred ounces sell.
Cash flow from our own database
Free cash flow, as calculated by Trend & Ticker, is operating cash flow minus capital expenditure. Every figure below comes from the quarterly and annual filing data in our database and is shown in millions of dollars.
Operating cash flow by quarter, from the third quarter of 2024 through the second quarter of 2026, reads 1,872; 1,436; 1,058; 2,195; 1,664; 693; 1,495; and 2,048. First-half 2026 operating cash flow totals 3,543, against 3,253 in the first half of 2025, an increase of 8.9% as calculated by Trend & Ticker. View Freeport-McMoRan financial data
Capital expenditure by quarter, over the same stretch up to the first quarter of 2026, reads 1,199; 1,239; 1,172; 1,261; 1,056; 1,005; and 973. Our data does not hold a second-quarter 2026 capital expenditure figure, so free cash flow for that quarter is not calculated here. Calculated free cash flow for the seven quarters with data reads 673; 197; negative 114; 934; 608; negative 312; and 522. First-quarter 2026 capital spending was 17.0% below the first quarter of 2025, as calculated by Trend & Ticker. View Freeport-McMoRan financial data
Annual revenue for fiscal 2022 through fiscal 2025 reads 23,271; 22,703; 25,169; and 25,186. Annual net income over the same years reads 3,468; 1,848; 1,889; and 2,204. As calculated by Trend & Ticker, the 2025 net margin was 8.8%, up from 7.5% in 2024. Net income rose 16.7% in 2025 while revenue rose only 0.1%. View Freeport-McMoRan financial data
The gap between net income growth and revenue growth points to margin, not volume. Revenue was almost unchanged, so the extra net income came from costs or prices rather than from selling more. The annual figures alone cannot separate those two causes.
Share count and what dilution would mean here
Dilution means each existing share owns a smaller slice of the company, usually because new shares are issued. Our data shows the opposite trend so far. The diluted weighted share count was 1,451 million in fiscal 2022 and 1,443 million in fiscal 2025, a fall of 0.6% as calculated by Trend & Ticker. Shares outstanding are listed at 1,436 million in our company record.
Our data holds quarterly buyback figures only for 2024 through 2026, so it cannot show how much of the fall came from repurchases in earlier years. Within that period, the company repurchased 93 million dollars of stock in the first quarter of 2026 and 110 million in the second. As calculated by Trend & Ticker, that is 203 million combined. Those amounts are small against operating cash flow of 3,543 million over the same two quarters.
What the cash figures cannot settle
Dividends in the periods in our data run at about 216 million dollars a quarter. Those payments hold steady. Operating cash flow does not. It fell to 693 million in the fourth quarter of 2025 and reached 2,195 million in the second quarter of 2025, a swing of more than 1,500 million between two quarters. A single quarter should not be read as a trend.
The cash series also cannot explain the operating reasons behind a quarter. The database records the cash, not the mine's throughput history. Freeport's operational updates supply the throughput numbers, and the two sources must be read together.
What would change the picture
Three inputs would change the reading above. A second-quarter 2026 capital expenditure figure would complete the free cash flow series, which is the most immediate gap in our data. A throughput figure for each quarter from the mine would show whether the mill is climbing steadily or moving in steps. The realized copper price, once reported, would test whether the guidance of more than $6.50 per pound holds across the year.
None of these inputs is in hand yet, and the piece does not assume any of them. Each one would be checked against the company's filings before it is used. Until then, the defensible claims are the ones tied to the figures above: the quarterly output, the mill rate, the guided cost and price, and the cash series in our database.
The open questions for the next report
Two things will shape how the rest of 2026 reads. The first is whether the 60,000 ounces of deferred gold reach buyers in the fourth quarter. The second is whether the Grasberg mill moves from about 67% of its normalized rate toward the 80% of capacity the company targets for mid-2027.
Our cash flow series will show the financial effect once the next quarter is filed. It cannot show whether the mill reached its targets, and that answer depends on the operating updates Freeport publishes.




 English
 Arabic
 French
 Spanish
 Portuguese
 Deutsch
 Turkish
 Dutch
 Italiano
 Russian
 Romaian
 Greek