


Ascending and Descending Triangle Pattern on TradingView: Setup and Drawing Tips
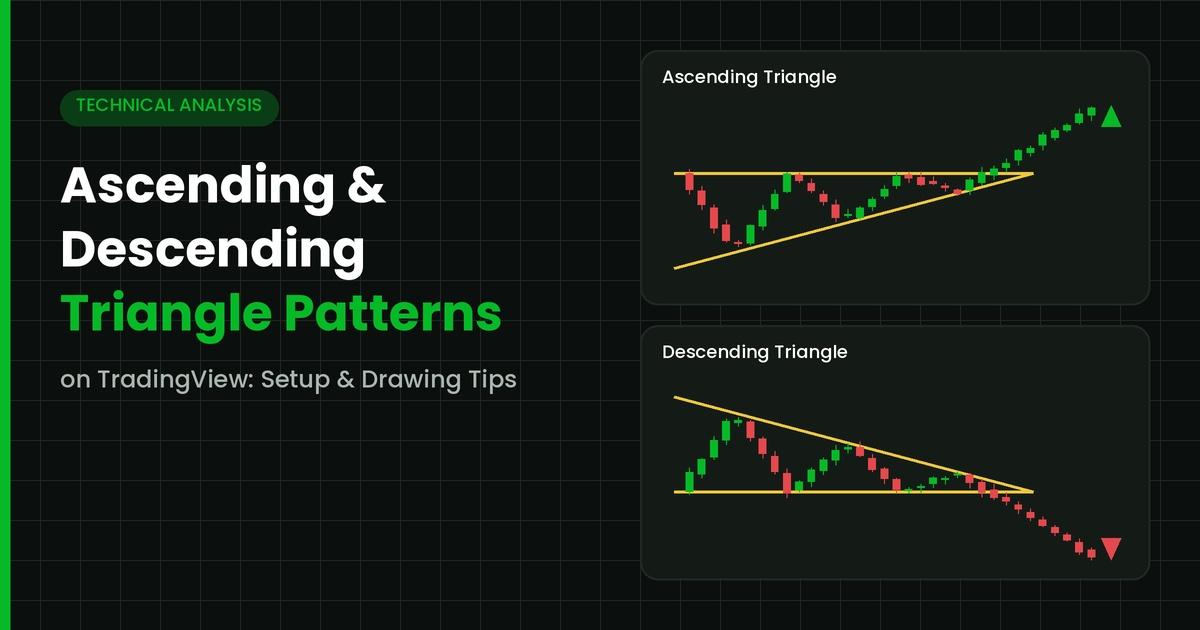
Chart patterns have guided traders for decades. Among them, triangles remain some of the most reliable and easy-to-spot formations. However, spotting a triangle and drawing it correctly are two very different skills.
In this guide, you will learn how the ascending and descending triangle pattern works, how to set up your TradingView chart, and how to draw each line with precision. You will also learn how to trade triangle patterns with clear entry, stop and target rules. Finally, we will cover symmetrical triangle trading, since it often appears alongside the other two.
Whether you trade stocks, forex or crypto, these principles apply across markets and timeframes.
What Is a Triangle Pattern?
A triangle is a consolidation pattern. In simple terms, price squeezes into a narrowing range before it breaks out. Two trend lines form the boundaries. One connects the highs, and the other connects the lows.
As the range tightens, buyers and sellers reach a temporary balance. Eventually, one side wins. That moment is the breakout, and it is usually followed by a sharp move.
There are three main types:
- Ascending triangle: flat resistance with rising support.
- Descending triangle: flat support with falling resistance.
- Symmetrical triangle: both lines slope toward each other.
Each type tells a slightly different story about market pressure. Therefore, reading the shape correctly is the first step to trading it well.
The Ascending Triangle Explained
An ascending triangle forms when price repeatedly hits the same resistance level. Meanwhile, each pullback finds buyers at a higher price than before. As a result, you get a flat top line and a rising bottom line.
This structure shows that buyers are getting more aggressive. They step in earlier on every dip. Sellers, on the other hand, defend only one fixed price. Over time, that supply gets absorbed, and price often pushes through the ceiling.
For this reason, the ascending triangle is generally viewed as a bullish continuation pattern. It is most reliable when it appears during an existing uptrend.
Key signs to look for:
- At least two clear touches on the flat resistance.
- At least two higher lows on the rising support.
- Shrinking volume as the pattern develops.
- A volume spike on the breakout candle.
That said, no pattern is guaranteed. Ascending triangles can break down too, especially in weak markets. So always wait for confirmation.
The Descending Triangle Explained
The descending triangle is the mirror image. Here, price keeps finding support at the same level. However, each bounce fails at a lower high. Consequently, the chart shows a flat bottom line and a falling top line.
This tells you that sellers are gaining control. They sell earlier on every rally. Buyers, in contrast, only defend one floor. Once that floor gives way, price often drops quickly.
Because of this, the descending triangle is usually treated as a bearish continuation pattern. It carries the most weight inside an established downtrend.
Watch for these signals:
- At least two touches on horizontal support.
- At least two lower highs on the falling resistance.
- Volume fading during the consolidation.
- A strong close below support with rising volume.
In short, the ascending and descending triangle pattern pair works as opposite sides of the same idea. One shows growing demand, and the other shows growing supply.
Symmetrical Triangle Trading Basics
A symmetrical triangle forms when price makes lower highs and higher lows at roughly the same rate. Both trend lines slope inward and meet at a point called the apex.
Unlike the other two, this pattern has no built-in bias. It simply shows indecision. Neither buyers nor sellers are in control yet.
As a rule, symmetrical triangle trading works best when you respect the prior trend. Breakouts tend to follow the direction price was moving before the triangle formed. Still, you should never assume. Instead, let the market show its hand first.
Another useful tip involves timing. Breakouts that happen around two-thirds of the way toward the apex tend to be cleaner. On the other hand, breakouts very close to the apex often lack momentum. In those cases, price can drift sideways rather than trend.
Setting Up Your TradingView Chart
Before you draw anything, prepare a clean workspace. A cluttered chart makes pattern recognition much harder.
Step 1: Choose your candle style. Standard candlesticks work best for triangles. They show both bodies and wicks, which helps you place lines accurately.
Step 2: Pick the right timeframe. Start with a higher timeframe, such as the 4-hour or daily chart. Patterns on these timeframes are more meaningful. Afterwards, you can drop to a lower timeframe to fine-tune entries.
Step 3: Add volume. Volume is essential for confirmation. On TradingView, the volume indicator can be added from the Indicators menu in seconds. Keep it in a separate pane below price.
Step 4: Remove extra indicators. Too many oscillators distract from price structure. For pattern work, price and volume are usually enough.
Step 5: Turn on magnet mode. This feature snaps your drawing points to the nearest candle high, low, open or close. As a result, your lines become more precise and consistent.
Drawing Tips for Accurate Triangles
Drawing is where most traders go wrong. A slightly misplaced line can turn a valid setup into a false signal. So let us walk through the process carefully.
Use the Right Tools
The Trend Line tool is the most flexible option. You can open it quickly with the Alt + T shortcut. For flat support or resistance, the Horizontal Line or Horizontal Ray tool works well too.
TradingView also offers a dedicated Triangle Pattern tool under the pattern drawings. It is handy for marking the structure visually. However, many experienced traders still prefer two separate trend lines, since they are easier to adjust.
Connect Real Swing Points
Each line needs at least two touches. Three or more touches make the pattern stronger. Furthermore, these touches should be clear swing highs or swing lows, not random candles in the middle of a move.
Start with the flat line first. For an ascending triangle, mark resistance. For a descending triangle, mark support. Then draw the sloping line through the higher lows or lower highs.
Wicks or Bodies? Stay Consistent
This question comes up often. The honest answer is that both methods work. What matters most is consistency. If you draw on wicks, use wicks for every touch. If you prefer candle bodies, stick with bodies.
In noisy markets, bodies often give cleaner lines. In calmer markets, wicks may show the true extremes better. Either way, avoid forcing a line through price just to make the pattern fit.
Allow Small Tolerances
Markets are not perfect. Price may poke slightly above resistance or slightly below support. Therefore, treat each line as a zone rather than a single exact price. A small overshoot does not cancel the pattern.
Extend Lines Into the Future
Once the pattern is drawn, extend both lines to the right. This shows where the apex will form. It also helps you see where a breakout is likely to occur.
Save Your Drawings
Finally, use templates and save your layouts. This saves time and keeps your analysis organized across several charts.
How to Trade Triangle Patterns
Now that your chart is set up, let us look at how to trade triangle patterns step by step. A clear plan removes emotion and keeps risk under control.
1. Wait for a Confirmed Breakout
Never enter just because price touches a line. Instead, wait for a candle to close beyond the boundary. A close is far more reliable than an intrabar spike.
Additionally, check volume. A genuine breakout is usually supported by above-average volume. Weak volume often signals a false move.
2. Choose Your Entry Style
There are two common approaches:
- Breakout entry: Enter on the close of the breakout candle. This catches strong moves but can lead to more false signals.
- Retest entry: Wait for price to return and test the broken line. Old resistance often becomes new support, and vice versa. This entry is slower but usually offers better risk-to-reward.
Neither method is perfect. Consequently, many traders split their position and use both.
3. Place a Logical Stop Loss
Your stop should sit where the trade idea is clearly wrong. For an ascending triangle breakout, that is usually below the rising support line or below the last higher low. For a descending triangle breakdown, place it above the falling resistance or the last lower high.
4. Set a Measured Target
The classic target uses the height of the triangle. First, measure the distance between the two lines at the widest part of the pattern. Then project that distance from the breakout point.
TradingView’s Price Range tool makes this easy. Simply measure the height and copy it to the breakout level.
5. Manage the Trade
Markets rarely move in a straight line. So consider taking partial profits near the target. You can also trail your stop as price moves in your favor. Above all, risk only a small, fixed percentage of your account on each trade.
Common Mistakes to Avoid
Even with a solid plan, some errors appear again and again. Here are the most common ones.
Forcing patterns. Not every consolidation is a triangle. If the touches are unclear, skip the trade.
Ignoring the trend. An ascending triangle in a strong downtrend is less reliable. Similarly, a descending triangle in a strong uptrend deserves extra caution.
Entering too early. Anticipating the breakout feels exciting. However, it often leads to losses when price stays inside the range or breaks the other way.
Skipping volume. Volume is your best filter against fakeouts. Without it, you are trading half blind.
Trading near the apex. As mentioned earlier, late breakouts tend to fade. In that case, the pattern may already have lost its power.
Overtrading lower timeframes. Triangles on one-minute charts appear constantly. Unfortunately, most of them are noise.
Final Thoughts
The ascending and descending triangle pattern is one of the clearest tools in technical analysis. It shows you, visually, which side of the market is gaining strength. When it is drawn correctly on TradingView and confirmed with volume, it can offer well-defined entries, stops and targets. Likewise, symmetrical triangle trading adds a flexible option for markets that lack a clear direction. Still, every pattern is about probability, not certainty, so practice on historical charts before risking real capital.
Many traders also pair manual pattern analysis with indicator-based signals to double-check their bias. If you are researching tools for that purpose, GainzAlgo is one option traders often look into, and a common question is “is GainzAlgo legit?” The best way to answer that is to review independent user feedback, test any tool on past data, and confirm it fits your own trading rules. In the end, a sound process and disciplined risk management matter far more than any single tool or pattern.

 English
 Arabic
 French
 Spanish
 Portuguese
 Deutsch
 Turkish
 Dutch
 Italiano
 Russian
 Portuguese (Brazil)
 Greek