


Copper Historical Price Chart: Trends, Key Changes and Market Outlook
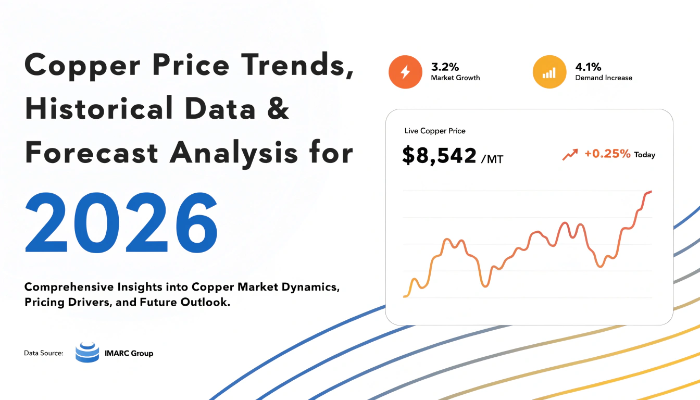
Global Copper Prices Outlook – Q3 2026
Copper price trend remained bullish during Q3 2026, with the international LME benchmark averaging USD 14,104/MT, an increase of approximately 6% compared with USD 13,329/MT in Q2 2026. Tight mine supply, strong industrial consumption, and growing electrification requirements supported the upward movement. The Copper Historical Price Chart provides historical pricing insights to help businesses assess market fluctuations and procurement costs.
According to IMARC Group's Q3 2026 price-tracking database and methodology, regional copper prices varied across major international markets. Indonesia recorded the highest reported price, followed by China and Malaysia, while the USA and Canada remained comparatively lower. These differences reflect regional supply conditions, industrial demand, trade flows, and procurement costs.
Copper Prices Q3 2026: Regional Price Snapshot
The following table presents the reported copper prices across five major markets during Q3 2026.
- USA: USD 14090/MT
- Canada: USD 14231/MT
- Malaysia: USD 15090/MT
- Indonesia: USD 16120/MT
- China: USD 15845/MT
The regional spread highlights differences in physical availability, sourcing costs, and market conditions. Indonesia recorded the highest price at USD 16120/MT, while the USA reported the lowest at USD 14090/MT. China and Malaysia occupied the middle range, reflecting their substantial manufacturing and industrial consumption requirements. These variations underline the importance of regional supplier assessments and logistics planning for international buyers.
Get A Sample Report Today - https://www.imarcgroup.com/copper-pricing-report/requestsample
Copper Prices by Country: Regional Market Analysis
North America: USA and Canada
The USA recorded USD 14090/MT, while Canada registered USD 14231/MT in Q3 2026. Both markets remained influenced by industrial consumption, electrical infrastructure investments, and cross-border trade.
In the USA, tariff uncertainty encouraged inventory accumulation, affecting the availability of copper across international exchanges. Canadian market conditions were influenced by industrial requirements, mining activity, and trade relationships. The supplied quarterly figures do not establish separate country-level price changes against Q2.
Asia-Pacific: China, Malaysia and Indonesia
Indonesia recorded the highest reported price at USD 16120/MT, followed by China at USD 15845/MT and Malaysia at USD 15090/MT.
China remained a major source of global copper demand, supported by electrical equipment, construction, manufacturing, and renewable energy applications. Malaysia benefited from demand associated with electronics and industrial production, while Indonesia's pricing reflected its regional supply and procurement conditions.
The higher reported Asian prices compared with North America highlight differences in regional pricing and physical market availability.
Copper Supply and Demand Overview – Q3 2026
Copper supply remained constrained by mining disruptions, declining ore grades, and limited concentrate availability. These challenges affected mining output and increased pressure on smelting operations.
Treatment and refining charges moved deeper into negative territory, indicating tight concentrate availability and challenging processing economics for smelters.
On the demand side, electricity networks, renewable energy installations, electric vehicles, construction, and data centre infrastructure continued supporting consumption. These applications require copper for wiring, transformers, motors, power distribution, and electrical components.
The combination of constrained raw material supply and resilient industrial consumption contributed to higher benchmark prices during the quarter.
Copper Price Trend and Historical Index Analysis
The international LME copper benchmark averaged USD 14,104/MT in Q3 2026, compared with USD 13,329/MT in Q2 2026. This represented an increase of approximately 6% quarter-on-quarter.
The movement reflected tighter concentrate availability, strong investment demand, and tariff-related inventory shifts. During September, the benchmark reached a record USD 14,797/MT in the second half of the month, highlighting the strength and volatility of the market.
For procurement managers, quarterly index comparisons help evaluate supplier quotations, identify purchasing opportunities, and understand changes in raw material costs.
Copper Price Chart: Historical Movement and Market Outlook
Historical price charts help businesses understand long-term movements, quarterly fluctuations, and changes in market direction. Comparing benchmark prices with regional observations can also help buyers evaluate differences between international metal values and local procurement costs.
Over the next 12 months, copper prices are expected to remain sensitive to mining output, global inventories, industrial consumption, and international trade policies.
Growing investments in electricity infrastructure, renewable energy, electric vehicles, and data centres could support demand. However, improved refined production, weaker manufacturing activity, and currency movements may limit further increases.
Businesses should monitor exchange inventories, mining announcements, treatment charges, and trade developments while preparing procurement budgets for 2027.
Key Factors Affecting Copper Prices: Quarterly Perspective
Several factors influenced copper prices during Q3 2026:
- Mining supply: Operational disruptions and declining ore grades restricted concentrate availability.
- Industrial demand: Electrical infrastructure, construction, automotive manufacturing, and electronics supported consumption.
- Energy costs: Higher electricity and fuel expenses affected mining, smelting, and refining operations.
- Trade policies: US tariff uncertainty influenced inventory movements and regional price differences.
- Freight expenses: Transportation costs and shipping conditions affected delivered procurement prices.
- Currency movements: US dollar fluctuations influenced international trading and purchasing decisions.
Chlor-alkali demand is not a primary direct driver of copper pricing; electrical and industrial applications are considerably more relevant.
What Is Copper and Where Is It Used?
Copper is a naturally occurring metallic element valued for its electrical conductivity, thermal performance, corrosion resistance, and flexibility. These properties make it an essential raw material across several industries.
Its major applications include electrical wiring, power transmission, construction, plumbing, automotive components, electronics, renewable energy equipment, and industrial machinery.
The expansion of electrification and modern infrastructure continues to strengthen copper's importance in global manufacturing and industrial supply chains.
Recent Copper Market Developments: Q3 2026 Highlights
Several developments influenced international copper market conditions:
- Inventory relocation: Expectations surrounding US import tariffs encouraged substantial copper stockpiling in the USA.
- Mining constraints: Limited concentrate availability and production disruptions increased supply-side pressure.
- Smelter challenges: Negative treatment and refining charges encouraged some Chinese smelters to consider production cuts and maintenance.
- Infrastructure investments: Electricity networks, renewable energy, and AI-related infrastructure supported long-term consumption expectations.
These developments highlighted the importance of trade policies, mining output, and inventory distribution in determining international copper prices.
Frequently Asked Questions About Copper Prices
What Was the Copper Price Trend in Q3 2026?
The LME copper benchmark averaged USD 14,104/MT in Q3 2026, increasing approximately 6% from Q2 2026. Limited concentrate availability and industrial demand supported the increase.
What Does the Copper Price Chart Show?
The Copper Price Chart illustrates historical benchmark movements, quarterly fluctuations, and changing market conditions. It helps buyers evaluate purchasing costs and identify pricing patterns.
What Is the Copper Price Forecast 2026?
Copper prices are expected to remain sensitive to mining supply, global inventories, and industrial demand over the next 12 months. Electrification investments may support prices, while improved production and weaker manufacturing activity could moderate growth.
Contact Us:
IMARC Group
134 N 4th St., Brooklyn, NY 11249, USA
Email: sales[@]imarcgroup.com
Tel No:(D) +91 120 433 0800
United States: +1-201971-6302

 Arabic
 French
 Spanish
 Portuguese
 Deutsch
 Turkish
 Dutch
 Italiano
 Russian
 Romaian
 Portuguese (Brazil)
 Greek